This post is a little different from the usual fare at this blog, as I am discussing a paper on which I’m a co-author. My collaborators and I just put up a paper in the open-access journal PLOS ONE. We analyzed genetic data from members of the Maasai tribe in Kenya and detected genes related to lactase persistence and cholesterol regulation that are under positive selection.
The Maasai and their Diet
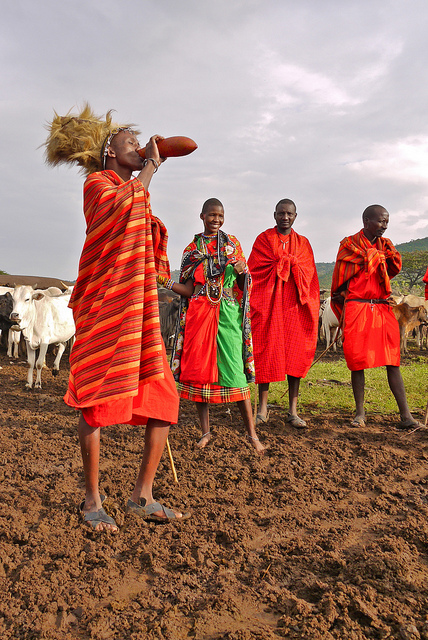
The Maasai are a pastoralist tribe living in Kenya and Northern Tanzania. Their traditional diet consists almost entirely of milk, meat, and blood. Two thirds of their calories come from fat, and they consume 600 – 2000 mg of cholesterol a day. To put that number in perspective, the American Heart Association recommends consuming under 300 mg of cholesterol a day. In spite of a high fat, high cholesterol diet, the Maasai have low rates of diseases typically associated with such diets. They tend to have low blood pressure, their overall cholesterol levels are low, they have low incidences of cholesterol gallstones, as well as low rates of coronary artery diseases such as atherosclerosis.
Even more remarkable are the results of a 1971 study by Taylor and Ho. Two groups of Maasai were fed a controlled diet for 8 weeks. One group – the control group – was given food rich in calories. The other group had the same diet, but with an additional 2 grams of cholesterol per day. Both diets contained small amounts of a radioactive tracer (carbon 14). (You’d never get approval for a study like this today, and for good reason.) By monitoring blood and fecal samples, the scientists discovered that the two groups had basically identical levels of total cholesterol in their blood. In spite of consuming a large dose of cholesterol, these individuals had the same cholesterol levels as the control group.
Here is how the authors concluded their study:
This led us to believe, but without direct proof, that the Masai have some basically different genetic traits that result in their having superior biologic mechanisms for protection from hypercholesteremia
Motivated by these results, we set out to identify genes under selection in the Maasai as a result of these unusual dietary pressures. We scanned the genome looking for genetic signatures of natural selection at work.
The Data
Our data comes from the International HapMap Project, a collaborative experimental effort to study the genetic diversity in humans. The HapMap Project has collected DNA from groups of people from genetically diverse human populations with ancestry in Africa, Asia and Europe. Their anonymized data is publicly available for free. One of the HapMap populations is a group of Maasai from Kinyawa, Kenya (n=156), and this is the population that we focus on.

HapMap does not sequence full genomes, as this would have been prohibitively expensive at the time of data collection. Instead, they employ a shortcut. If you take my DNA sequence and line it up against yours, the two sequences will be about 99.9% similar. But every once in a thousand letters, or so, there will be a difference. You may have an A where I have a C. The HapMap group measures the DNA sequence at these very locations, where humans are known to vary from each other. In essence, they’re sampling the genome, looking only at sites where we expect to see variation. In the jargon of the field, this method is called looking for Single Nucleotide Polymorphisms, or SNPs (pronounced snips).
Hunting for signatures of selection in genetic data
Once you have the data, what can you do with it? We wanted to detect signs of natural selection. The basic idea behind detecting selection in genomic data is quite simple, and it has to do with sex. Every sperm or egg cell that you produce contains a single genome, which is formed by shuffling together the two sets of genomes that you inherited from your parents. Viewed this way, the role of sex is to shuffle together the genomes in a population into new combinations. If you compare the DNA sequences of a group of people, you will see signs of this shuffling.
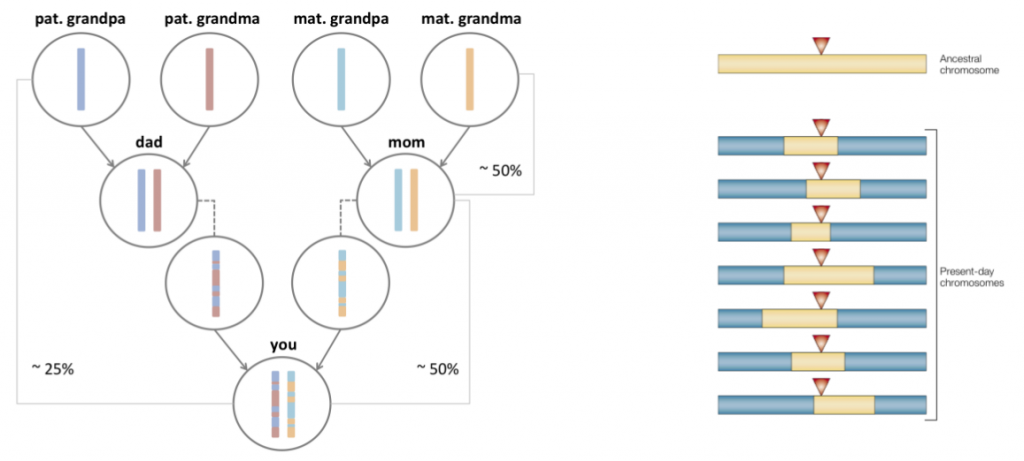
Now lets add natural selection to the mix. What happens if an individual is born with a new mutation that benefits their survival? Over time, you’d expect to see this mutation rise in frequency. Descendants of this individual will be over-represented in the population, as the fraction of people with this beneficial mutation goes up. In essence, the fingerprint of such selection is a reduction of genomic diversity. (I’m describing a particular model of selection here, known as positive natural selection. Some other types of selection can increase diversity, such as the selection on viruses to evade recognition by their host’s immune system.)

Eventually, new mutations will creep in again, and generations of sexual reproduction would build back the diversity. However, if the loss of diversity was sudden enough (strong selection) and not too long ago, you can still detect it today. There are statistical tests (Fst, iHS, XP-EHH) that can formally detect if the reduction in diversity at a given region is sufficient to infer selection. Sabeti et al have a nice review paper that discusses the different methods available to detect selection using genomic data.
Our Results
We used three different methods to detect selection, and our top candidate regions under selection are considered significant by at least two of the methods.
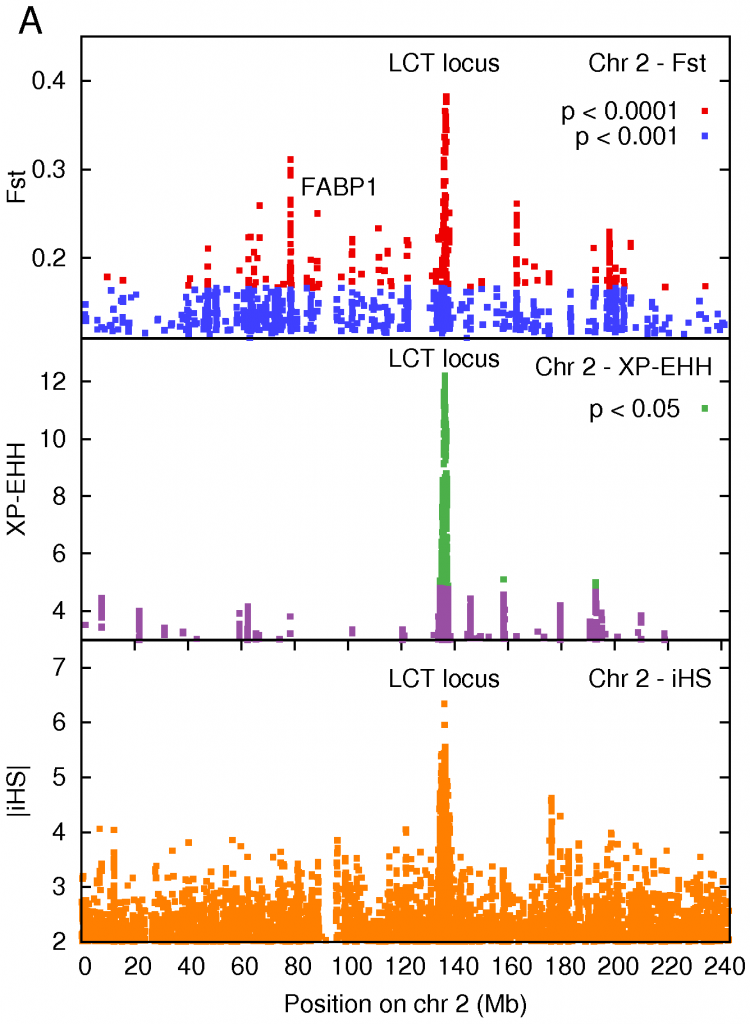
The strongest signal of selection was a region on Chromosome 2 that contained the LCT gene producing lactase, the enzyme that breaks down the lactose in milk. Interestingly, the default state in all adult mammals is to stop producing lactase in adulthood – our ancestors were all ‘lactose intolerant’. This makes sense from an evolutionary point of view, it forces children to wean from milk, and frees up the mothers resources. It turns out that different sets of mutations arose that gave European and African pastoralists the ability to digest milk. Those of us whose ancestors weren’t pastoralists still have trouble digesting milk.
This is a classic example of a selective sweep – a mutation confers an advantage (the ability to digest milk), and then sweeps through a population like wildfire. This result has been previously described in European populations, and also in African populations (including the Maasai) by Sarah Tishkoff and collaborators. Given that the Maasai consume large amounts of milk, it is not surprising that we see a very strong signal at this locus. We sequenced DNA in this region to confirm this result and, sure enough, we found that one of the lactase persistence conferring mutations identified by Tishkoff was present in the HapMap Maasai samples.
Two of the tests for selection that we used require that you make comparisons with another population. We chose the Luhya of Kenya as a our reference population. Among all the protein-altering mutations present in the data, the one that showed the largest population difference between the Maasai and Luhya (as measured by Fst) sits in the gene for a fatty acid binding protein FABP1. This protein is expressed in the liver, and the variant that occurs at higher frequency in the Maasai is associated with a lowering of cholesterol levels in Northern German women (n = 826) and in French Canadian men consuming a high fat diet (n = 623). Furthermore, studies in mice fed a high fat, high cholesterol diet showed that deactivating the FABP1 protein leads to protection against obesity, and lower levels of triglycerides in the liver, when compared to normal mice on an identical diet. These results suggest that this protein plays a role in regulating lipid homeostasis, and its selection in the Maasai may be diet-related.
On Chromosome 7, two of the methods we used to detect selection identified a cluster of genes that fall in the Cytochrome P450 Subfamily 3A (CYP3A). This family of genes is involved in drug metabolism, in oxidizing fatty acids, and in synthesizing steroids from cholesterol.
What’s next?
Computational methods can only take you so far. We have identified genes in candidate regions undergoing positive natural selection in the Maasai, possibly arising due to their unusual diet. But the case for selection can only be definitively made with an experimental study targeted to address the role of these genes in maintaining cholesterol homeostasis. We’re hoping to collaborate with experimental biologists to take these hypotheses forward and investigate their role in the evolutionary history of the Maasai.
So head over to PLOS, check out the paper, and let us know what you think.
Update: Here’s another blog post that discusses the paper, focusing more on the mixed genetic makeup of the Maasai.
References:
Kshitij Wagh, Aatish Bhatia, Gabriela Alexe, Anupama Reddy, Vijay Ravikumar, Michael Seiler, Michael Boemo, Ming Yao, Lee Cronk, Asad Naqvi, Shridar Ganesan, Arnold J. Levine, Gyan Bhanot (2012). Lactase Persistence and Lipid Pathway Selection in the Maasai PLOS ONE, 7 (9) : 10.1371/journal.pone.0044751
If you’d like to read more about selective sweeps, you may enjoy my post Why moths lost their spots, and cats don’t like milk. Tales of evolution in our time.
