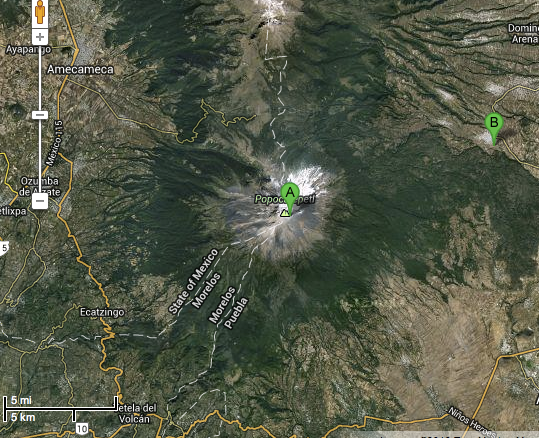
On June 17, the Popocatépetl volcano in the state of Puebla in Mexico belched out a pretty impressive looking volcanic plume. Fortunately for us, it was caught on webcam, at a town a safe distance away. Here’s the video (it’s been sped up):
Now, I’m guessing this explosion didn’t come as big surprise. Popocatépetl is a known active volcano. Even the Aztecs knew this, that’s why they named it the smoking mountain (in their language, popōca means ‘it smokes’ and tepētl means mountain). The volcano is under 24 hour surveillance by CENAPRED, who have also restricted access to anywhere within 12 kilometers of the crater.
Watching that video , two things leapt out at me. First, you can actually see the clouds react to the explosion just a little while after the plume emerges. That’s when the shock wave of the explosion (the BOOM) hits the clouds. The other thing that struck me was the incredible amount of stuff that’s rolling down the volcano’s slope *really* fast.
Here’s how Wired blogger and volcanologist Erik Klemetti describes what’s happening:
Now, these explosions come with a lot of force, and you can see after the initial explosion is how the clouds of water vapor around Popocatepetl shudder as the explosion front moves past. Then quickly, the upper flanks of the volcano turn grey from the rapid raining out of ash and volcanic debris (tephra).
So, let’s get our SCIENCE on, and try to dig beneath the surface of this volcanic eruption (figuratively speaking, of course). Here’s my first question: just how fast is that debris sliding down the volcano?
Here’s the plan. Let’s find the distance that the debris travels. Then we’ll time how long it took to cover that distance. Divide the distance by the time, and we’ve got the speed.
If you noticed, the video has a timestamp in the top-right corner. So it’s easy to time the debris as it rolls down the mountain. How about the distance? Well, first I wanted to find out where the video was recorded from, so I went to the URL on the youtube video. From there, it was easy to find the webcam feed, which actually tells you where the webcam is located. It’s in San Nicolás de Los Ranchos, a town that’s about 15 kilometers (9 miles) away from the crater.
Next, I zoomed in to the volcano on google Earth, and put down a marker at the center of the volcano (where the debris came from), and three more markers lower down on the volcano slope, right at the edge of the tree line.
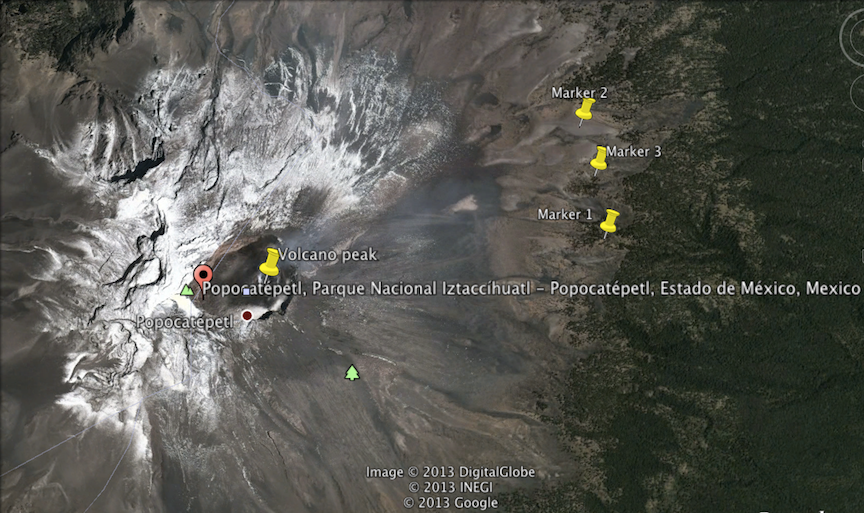
The reason for putting three markers on the right is so I can take the average of three distance measurements.
Now comes the fun part. Using Google Earth, I can actually fly over to San Nicolás de Los Ranchos, look up at the volcano, and see if those markers are at the right place.
That looks pretty reasonable to me. The markers are pretty much where the debris stops sliding in the video.
While we’re at it, just for fun, here’s a video of what the explosion would have looked like to residents of San Nicolás de Los Ranchos. I made this by landing on the town in Google Earth, looking up at the volcano, and then lining up the video volcano with the Google Earth volcano (the video is still sped up, though).
It just blows my mind that we have access to a life-sized map of the world (without stepping outdoors, that is).
Alright, enough fooling around. Now for some more gratuitous science.
I used the ruler tool in Google Earth to measure the on-the-ground distance between the markers. This takes into account the sloping terrain – it’s the distance you’d cover if you were to start walking from the lower marker, and walk straight up the volcano slope and into the crater (don’t try this at home, unless you’re the lava-walking dude in this crazy video).
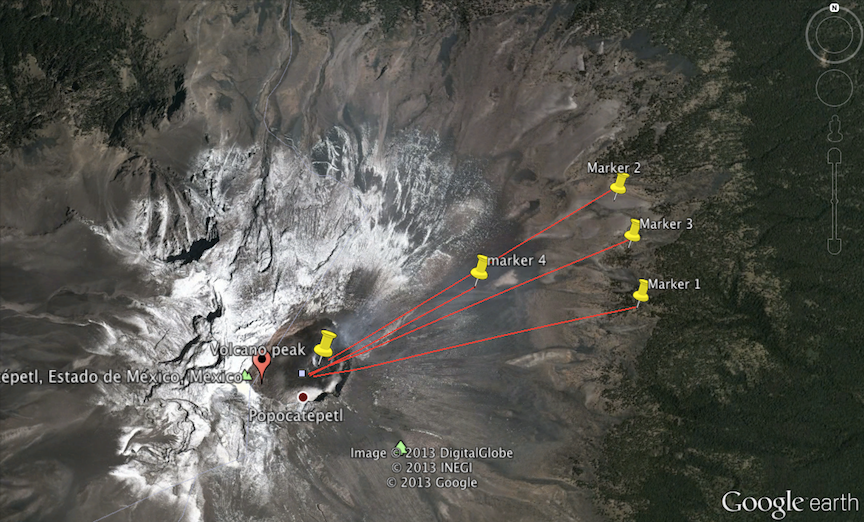
The average of the three measurements was 3.31 kilometers. That’s the average length of one of red paths.
Now, to measure the time. Looking at the timestamp on the video, I see that the volcano let out the plume at 13:23:38. Depending on what part of the debris you want to consider, it reaches the treeline somewhere between 13:24:22 and 13:24:46. So it took somewhere between 44 to 68 seconds to reach that point.
Divide the two numbers, and we get our speed. The slow estimate puts it at 49 meters/second (109 mph), and the fast estimate puts it at 75 meters/second (168 mph). Taking the average, we get 62 meters/second or 139 mph.
Since we got a pretty big variation, I decided to check my calculation by putting another marker half way down the mountain, and timing how long it took the plume to travel this new distance.
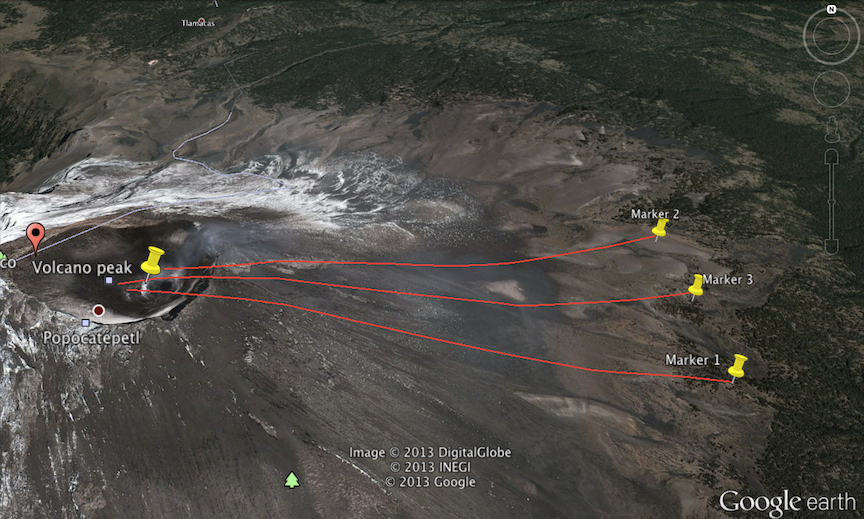
Here’s what the mountain looks like with the new marker on it (it’s a little hard to see, but there’s a fourth pin halfway along the red line):
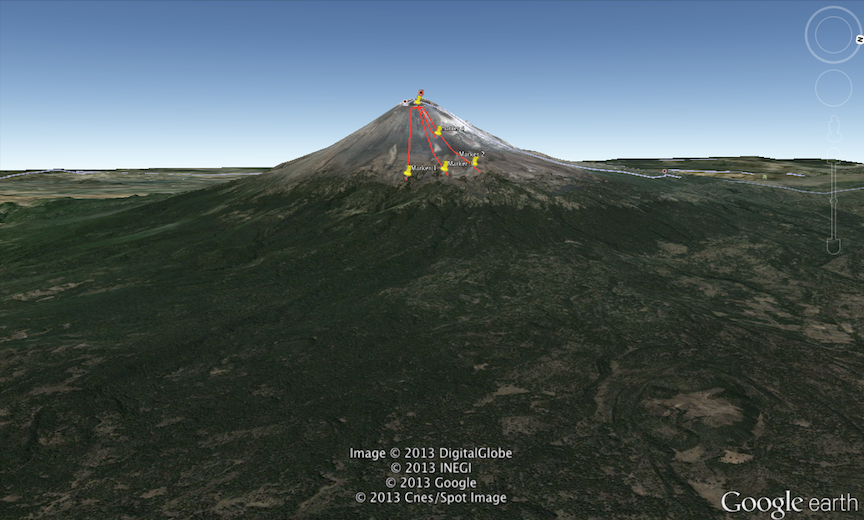
The distance to the halfway marker was 1.64 km, and the time was 26 seconds. I think these numbers are a bit more reliable than before. Divide distance by time, and you get a speed of 63 meters/second or 140 mph.
Hmm, that’s basically the same number from before, which is a bit odd. Given the huge uncertainty in our speed calculation, and the various factors like gravity and friction that can change the speed, this is just a coincidence. Nonetheless, I’d conclude that 140 mph is a pretty good estimate of the speed of debris flow down the volcano.
So now we’ve got the speed. What can we do with that? Surprisingly, we can actually use the speed of the mud to estimate the pressure inside the volcano. What follows is what physicists call an order-of-magnitude estimate – it’s a back-of-the-envelope calculation that will give us a rough answer. This is a dramatic simplification of the hairy physics that’s actually going on inside a volcano. Nonetheless, readers of this blog will know that I like these toy models, because they give you some insight in exchange for not a lot of work.
With that in mind, let’s go on.
Picture the moment that the volcano explodes. Inside the volcano, hot gases have built up a huge pressure, whereas outside, everything is normal. At the top of the volcano sits a chunk of rock, like a cork on a champagne bottle, that’s being pushed up from the inside by high pressure gas. We can use an equation called Bernoulli’s equation to relate the pressure at the top and at the bottom of this chunk of rock.
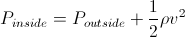


But, wait. What’s the density of mud at the top of a volcano? That’s a tough one.
Well, according to this paper, “the density of the rock overlying the gas reservoir” of a volcano is about 2,300 to 3,000 kilograms per cubic meter (I’m glad I’m not the grad student who had to measure that). Let’s use the average, of 2,650 kg/cubic meter. Plug in the numbers, and we get that the pressure that built up inside Popocatépetl before it exploded is about 54 atmospheres, or 609 pounds per square inch!
BOOM. 600 psi. That’s about the pressure inside a paintball gun, except imagine thousands of paintball guns aimed at one heck of a paintball. It’s also the water pressure at a depth of about 400 meters, which is about as deep as most submarines can venture.
Is this number even in the right ballpark? Fortunately, I found a PhD thesis that builds a detailed scientific model relating the pressure inside a volcano to the speed of the eruption. And what’s more, this model was built specifically to understand the Popocatépetl volcano in Mexico (science – it’s the gift that keeps on giving).
Here’s a figure from the paper. If I understand it correctly, the author basically heated and squeezed volcanic rocks, and then measured how much pressure it took for them to give way. The data includes rocks from an eruption of Popocatépetl in 2003. The vertical axis represents the pressure that it takes to obliterate the rock, measured in MPa, or millions of Pascals (to go from MPa to atmospheric pressure, just multiply by 10). The horizontal axis has to do with how porous the rock is. The figure includes data using rock from many volcanic eruptions (including some real famous ones), but take a look at the blue stars – that’s data from Popo (aka the big P).

Depending on how porous the rock is, the pressure needed to cause an eruption at Popocatépetl varies from about 50 atmospheres to 200 atmospheres. That cluster of blue stars on the right – they’re all at around 50 atmospheres. So our calculation of 54 atmospheres for the pressure inside Popocatépetl before an eruption, while it may be simplistic, is probably within a factor of 2 or so from the actual result.
Footnotes:
1. By the way, there’s another neat piece of physics that you can see in the video. If you look at the plume of smoke that erupts upwards from the volcano, you’ll notice that it keeps rising until it levels off at a maximum height – which is where it’s neutrally buoyant. It’s actually possible to use that height to measure the strength of the volcano (i.e. its eruption rate).
2. Here’s a paper that build a better model than the one I used to relate the pressure inside a volcano the velocity of the stuff it spews out. It’s also where I got the number for the density of rock in the top of a volcano.
Relationships between pressure, volatile content and ejecta velocity in three types of volcanic explosions. Lionel Wilson. Journal of Volcanology and Geothermal Research, 1980
3. The very detailed PhD thesis filled with numerical models, experimental results and figures showing how ejecta velocity of a volcano is related to the pressure inside. This one specifically models the Popocatépetl volcano.
A model of volcanic explosions at Popocatépetl volcano (Mexico): Integrating fragmentation experiments and ballistic analysis. MA Alatorre Ibargüengoitia.