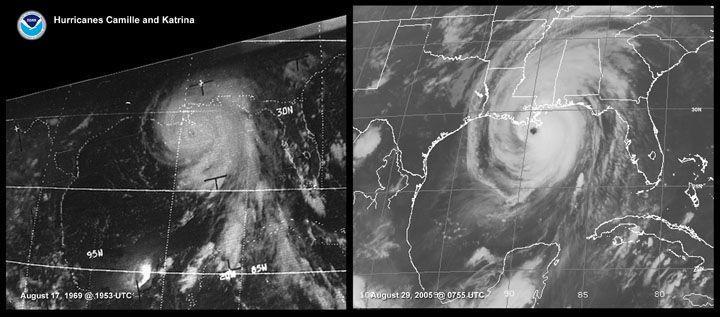
As Hurricane Katrina surged towards New Orleans, people faced the unthinkable prospect of abandoning their homes and finding shelter. Worst affected were some of the city’s most vulnerable citizens, the poor and the elderly, parents with young children, people without cars, and people living in flood-prone areas. Among those who stayed back, many were old enough to remember Hurricane Camille, a category 5 storm that devastated the region in 1969. Many homes were spared from flooding then, so it stood to reason that they should hold up to Katrina, also a category 5 storm that was demoted to a category 3 by the time it hit land. Sadly, they were mistaken, as the category rating of the hurricane was not the best measure of the raw destructive power of the storm.
The Saffir-Simpson rating system
In the western hemisphere, hurricanes are all rated on the Saffir-Simpson scale, an empirical measure of storm intensity devised in 1971 by civil-engineer Herbert Saffir and meteorologist Bob Simpson. To compute a storm’s category rating, you have to measure the highest speed sustained by a gust of wind for an entire minute. The wind’s speed is measured at a height of 10 meters because wind speeds increase as you climb higher, and it is here that they do the most damage. Based on how large this maximum speed is, a storm is assigned to one of five different categories.
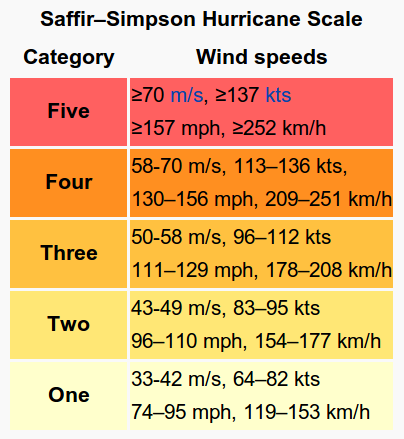
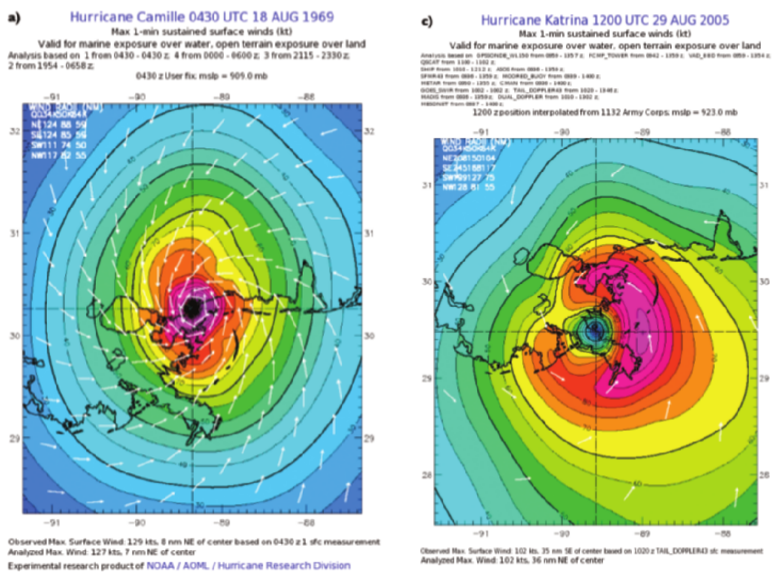
The problem with this number is that it only captures one aspect of a storm’s intensity – the highest speed that it can sustain. Not only is it tricky to measure this peak speed, but different organizations may come to different conclusions about it, depending on their coverage of the wind data. This number doesn’t tell you anything about the size of the storm, nor about how the wind-speeds are distributed overall.
Consider a tale of two storms – the first is fierce but more contained, whereas the second is larger, and though it has lower peak wind speed, these wind speeds are spread over a larger area. The SS scale would give the first storm a higher score, even though the latter may be more destructive. Based on the rating, people might have expected Katrina to be about as destructive as Camille.
A rip in the wind tapestry
So how can one take the true measure of a storm? Storms are dangerous because of the energy carried in the moving air. Unless you live in a windy city, or drive your car at high speed on an interstate, you probably don’t think of air as something that carries much energy. But in a storm, strong winds ram into stationary objects, like trees, buildings, or the surface of the ocean, and impart some of their energy of motion. Some structures can safely absorb this energy, while others will give way.
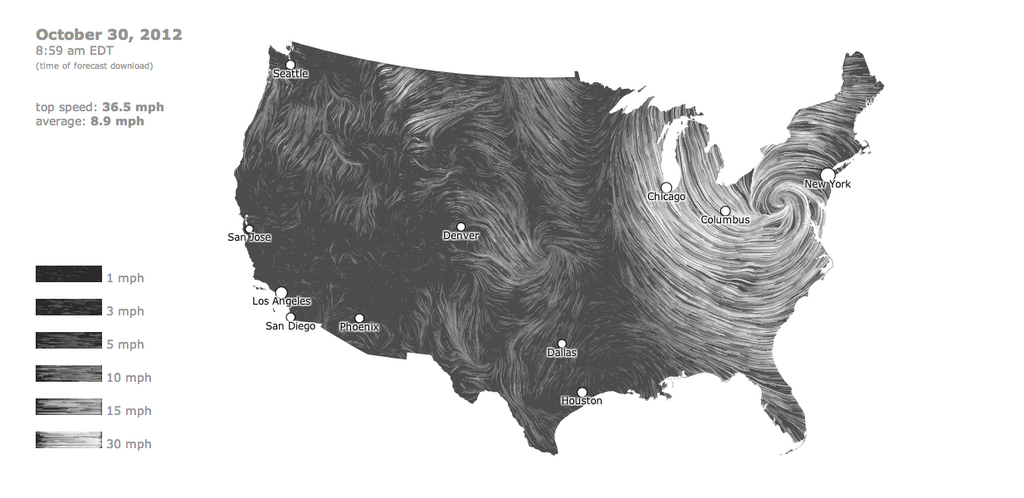
As Hurricane Sandy made its way through the US, many turned to this incredible real-time wind map to get a larger picture of the storm. I watched Sandy as it made landfall, and was mesmerized by the unexpected beauty that underlies this destructive force. On most days, if you look at the wind map, you’ll find a seamless tapestry made up of delicate threads and broader, sweeping strokes. The wind weaves its way through the central mountains, and brushes through the plains in wide swathes, leaving trails like a comb pulled through the hair of an unruly child. It’s a flow that is sculpted by geography and powered by the ebb and flow of weather systems. Visualizing this flow is like watching a globe-sized zen garden rearrange itself, tended not by any individuals, but by the blind, mathematical laws of fluid dynamics.
On this day, as Hurricane Sandy pummeled through the north-eastern US states, the winds started to pick up outside my window in New Jersey, and the trees swayed violently as the gusts grew stronger. On the wind map, there seemed to be a giant bald spot, a rip in the wind tapestry where from where threads had started to fray.
In essence, a hurricane creates a vortex, like the kind that forms when you drain the water from your bath tub. Vortices are strange, unwieldy creatures, a consequences of the non-linear equations that govern the flow of fluids. In normal situations, these vortices die out, as their energy drains out to the fluid around them. But hurricanes are self-sustaining, fed by evaporating columns of air rising from warm ocean water.
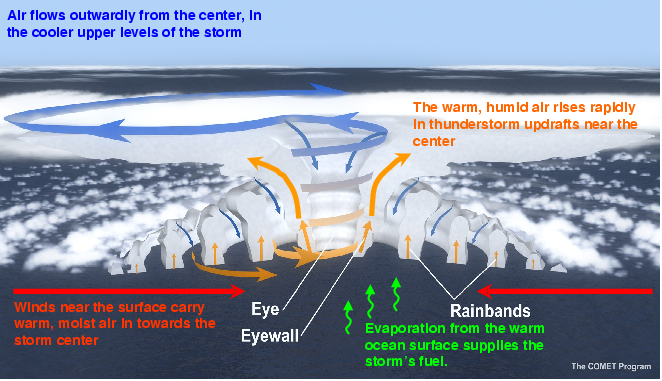
Scientists struggle to adequately model the dynamics of hurricanes. It’s a mathematical balancing act. One a larger scale, you have to worry about the flow of the atmosphere that’s responsible for steering the hurricane. On a finer-scale, you have to grapple with interactions near the core that give the storm its strength. You have to include just enough essential mathematics to reproduce the behavior of a real storm, while leaving out the details that can bog you down into a mire of calculations.
To get a small sense of the complexity of the task, this visualization shows a computer simulation of Hurricane Katrina forming (cue to unnecessarily dramatic blockbuster music)
And here’s a more down-to-earth video of an impressive computer simulation that was able to reproduce the known seasonal cycle of tropical hurricanes (or, as they call them, hurricane-like-vortices):
The measure of a storm
Predicting a storm is one half of the scientific story. The other part is figuring out how destructive it’s going to be. We can get a sense of a storms’ strength with a little bit of high school physics. You might remember that every object in motion carries a certain amount of energy, known as its kinetic energy. The kinetic energy of an object depends on the square of its speed, and is directly proportional to the mass of the object.
Imagine a gust of wind blows by your house, travelling at 50 miles per hour. How much energy does this wind gust carry, and what does that mean in terms of damage it can inflict?
Well, think of a storm as being built out of moving parcels of air. Each of these parcels has a certain amount of kinetic energy. To work this out, we first need the mass of each chunk (in kilograms). We can get this using a little trick. Let’s rewrite a kilogram in an odd way:
What we just did is write a kilogram as the product of kilogram per cubic meter — a density — times a cubic meter — a volume. So, the mass of an object is just its density multiplied by the volume. That means,
Kinetic Energy stored in a chunk of storm wind
Or,
Energy per cubic meter of storm
This equation tells you how much energy is sitting in each cubic meter of air that whizzes by your window. So let’s try plugging in some approximate numbers. Moisture laden air has a density of about 1 kilogram per cubic meter, and 50 miles per hour is about 22 meters per second.
Plugging in numbers, this tells us that a standard 2-liter coke bottle worth of storm wind at 50 mph carries about half a Joule of kinetic energy. That may not sound like a lot, and it isn’t (it’s about the energy you’d expend in poking someone). But consider what happens when you make the sizes bigger.
Imagine the trunk of a small car filled with storm wind, and you get up to 100 Joules of wind energy. That’s about the kinetic energy carried by a child accidentally stumbling into a glass door. Now take a Volkswagen Beetle, fill it with storm wind, and you get nearly 700 Joules of Wind Energy. That’s the kinetic energy contained in a shot put thrown by the world record holder. Finally, picture many times that energy ramming into a tree or a building, and you get a sense of the kind of damage a storm can deliver.
In other words, by adding up the contributions of these ‘bottles of wind energy’ over the real size of a storm, you start to get a sense of its true destructive potential.
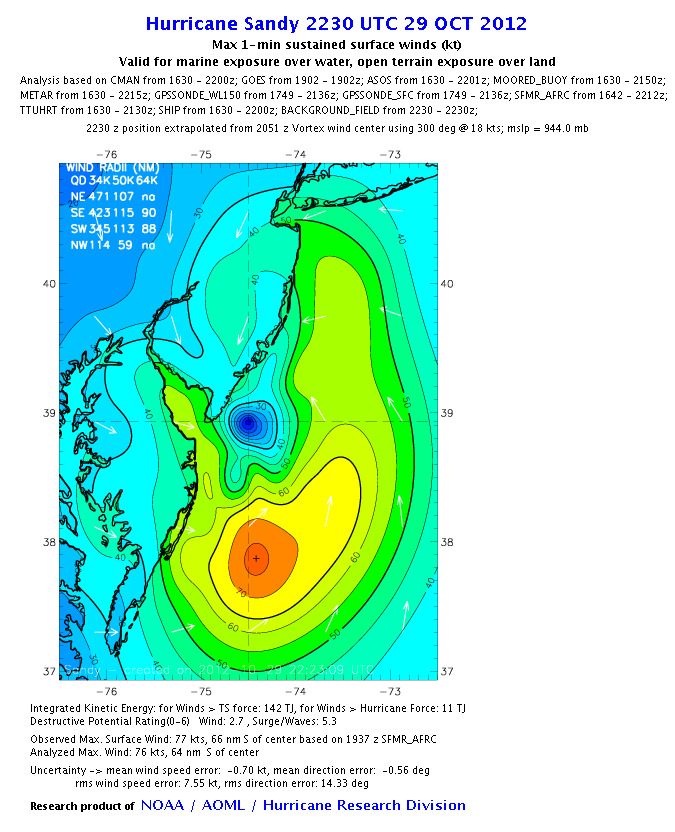
What makes this method very different from the SS scale is that different ‘wind bottles’ can have different wind speeds (think of bottling up all the different colors in the wind map above). By adding it all up, you learn much more than just the peak intensity of a storm. This number takes into account how the wind speeds are distributed throughout the bulk of a storm.
What I’ve described here is essentially a measure called the Integrated Kinetic Energy of a storm, and it is used by the National Oceanic and Atmospheric Administration to measure the strength of a storm. (See here for a good review. The main difference is that they only add up the energy for bottles of wind moving faster that a certain minimum speed, and the ‘bottles’ are much bigger than Volkswagens.)
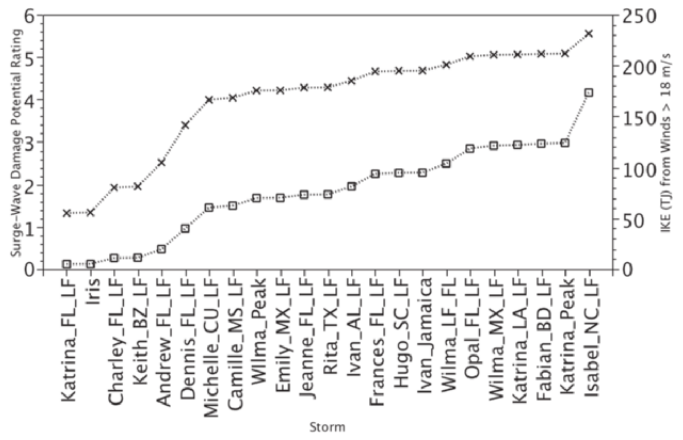
This leads us to a question that was bothering me a few days ago. You may have heard people predicting that Hurricane Sandy may be the biggest storm to hit the US, yet it’s only a category 1 storm. How can this be? Well, this plot helps make things clear.
It shows the integrated kinetic energy for hurricanes hitting the United States, measured when they strike land. I came across it on twitter via Brian McNoldy (@BMcNoldy), an atmospheric researcher at University of Miami.
#Sandy's integrated kinetic energy at landfall was second only to Isabel (2003), but was higher than Katrina (2005). pic.twitter.com/aHBVLQG8
— Brian McNoldy (@BMcNoldy) October 31, 2012
You can see that by this measure, Sandy exceeds Katrina in energy content, exceeded in the US only by Hurricane Isabel.
What’s more, the integrated kinetic energy of a storm is a good predictor of its potential to cause storm surges, where sea levels rise dangerously as the wind pushes against the ocean’s surface. Category ratings based on the SS scale, on the other hand, do not predict storm surges well.
By now, I hope I’ve convinced you that when you hear about a tropical storm or a hurricane, you should look for numbers beyond the SS category rating.
But there’s still another side to the story. Hurricanes bring on an onslaught of energy, but nature manages to fight back. Trees don’t topple like dominoes. Far from being passive agents, it turns out that trees have tricks up their sleeves (or rather, up their trunks) that help them stay rooted. To learn more, stay tuned for the next post on the science of hurricanes.
References
Powell, M., & Reinhold, T. (2007). Tropical Cyclone Destructive Potential by Integrated Kinetic Energy Bulletin of the American Meteorological Society, 88 (4), 513-526 DOI: 10.1175/BAMS-88-4-513
Sandy Wind Analyses at the Hurricane Research Division, NOAA
Operational Hurricane Track and Intensity Forecasting at the Geophysical Fluid Dynamics Laboratory, NOAA