Last Friday, the New York Times ran a cover page story about Håvard Rugland, a Norwegian man who scored an NFL tryout for the Jets, based on a youtube video called Kickalicious that has picked up nearly 2 million views. In this video, he pulls of a series of very impressive football kicks, with seemingly inhuman accuracy.
Personally, I found the last trick the hardest to believe (3:42 onwards). I wasn’t alone in my skepticism. Here’s what the New York Times had to say about it:
The most eye-popping trick is saved for last. Rugland punts one ball high into the air and then quickly kicks a second ball off a tee. The balls collide in midair.
“That last kick, it took about eight tries,” Rugland said. “The basketball kick, I wanted it to go straight in, but it kept hitting the rim. That actually took a while. That could have been like 40 tries.”
Rugland is so accurate on so many difficult kicks that his video almost seems too good to be true. It brings to mind doctored videos featuring other athletes, like one of the Los Angeles Lakers star Kobe Bryant leaping over a speeding Aston Martin (Bryant never would have risked his knees). But Rugland insisted his video was real. He said that NRK, Norway’s public broadcasting network, reviewed the raw videos and concluded they were legitimate.
So, inspired by Rhett Allain’s blog posts, I decided to try my hand at analyzing this video with physics.

I downloaded a clip of the last trick, and opened it up in Tracker, an open source physics toolkit for video analysis.
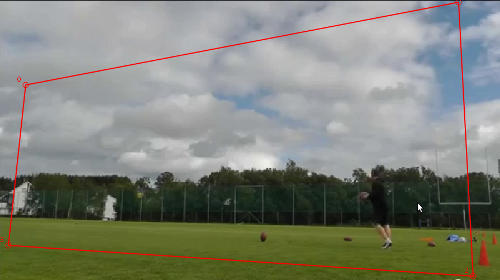
The first problem is that there is a pretty massive perspective distortion in the video. The video camera is pretty close to Rugland, and it’s inconveniently positioned at an angle. Fortunately, tracker has a handy tool that lets you morph the video to correct for this perspective distortion. (Here’s Rhett explaining how to use it).
Here’s the video before correcting for perspective:
And here it is afterwards:
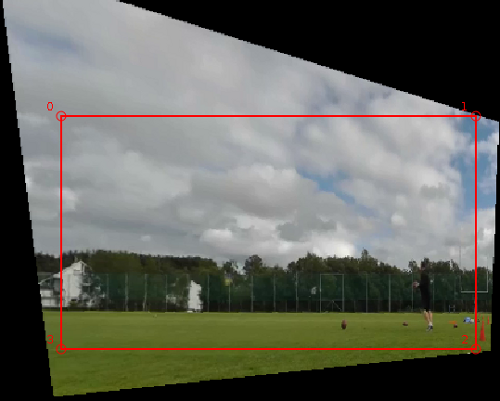
Before correction, the ‘parallel lines’ of the treetops, fence and the turf aren’t really parallel – they converge to a point. After the correction, they seem more or less parallel.
The next step is to track the two footballs. I made a video of what the trick shot looks like when you do this. The first ball is in red, the second in light blue, and the green dots show you the center of mass of the two balls (The center of mass is the midpoint of the line that connect the two balls).
So far, so good. Now, on to the physics. If these trickshots are legitimate, they should come close to obeying the laws of projectile motion. In particular, if you plot the height of each projectile over time, you should get a parabola described by the equation

Here 


If you haven’t seen this equation before, all you need to know is that it represents a parabola, and that you can test whether an object is really in free fall by fitting this equation to the data. What’s more, you can try and extract the known acceleration due to gravity.
To do this, take the coefficient of the 

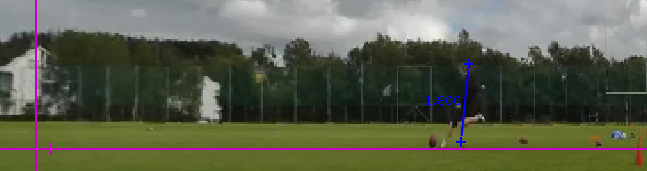
Does this work for the trick shot? The first thing I need to do is set the scale in the video, so we can convert on-screen distances to real life distances. To do this, I assumed that Rugland is about 6 feet tall (1.8 meters), and am guessing this is accurate to about 20% or so. So I don’t expect any result I get to be more accurate than this.
Update: Rugland told me on twitter that he is 1.9 meters tall, so this guess is well within 10 percent.
Now, to the plots! First up is the plot of the height of the first football (vertical axis), plotted versus time (horizontal axis).
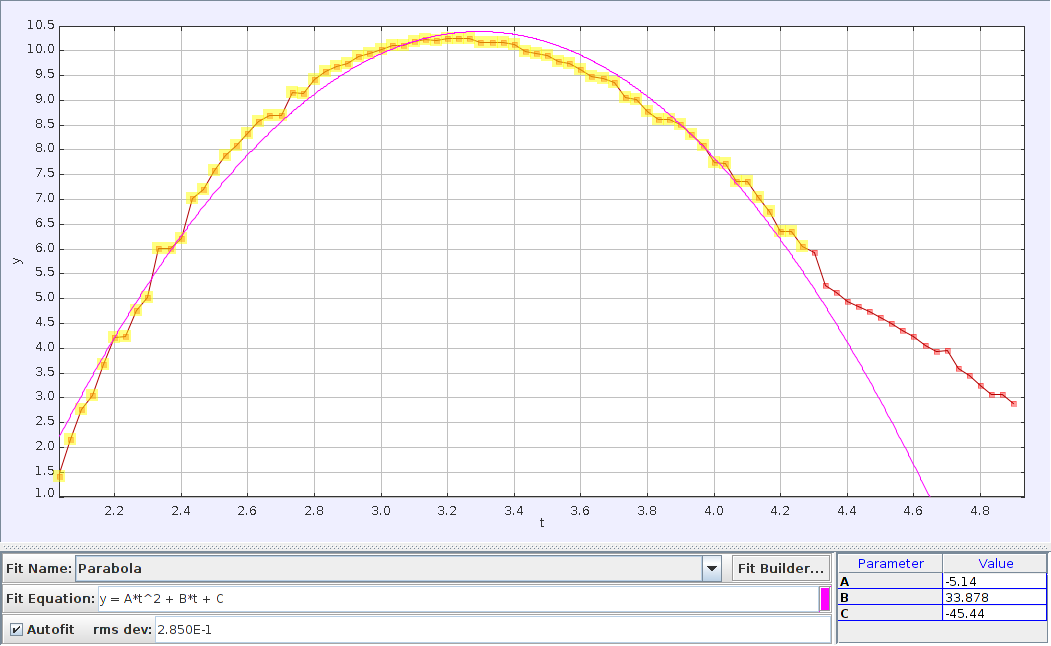
Tracker fits this curve to a parabola, and you can see that the trajectory of the ball (red line) is quite close to the parabola (pink line). I only used data from BEFORE the collision (in yellow) to fit the curve. After the collision, you wouldn’t expect it to stay on the same parabolic path. The curve fit is surprisingly good, considering that there’s definitely some wind resistance, lens distortion, and remaining issues with perspective.
Do we recover the value of gravitational acceleration (
How about the second ball? Here it is the curve for its height vs. time:
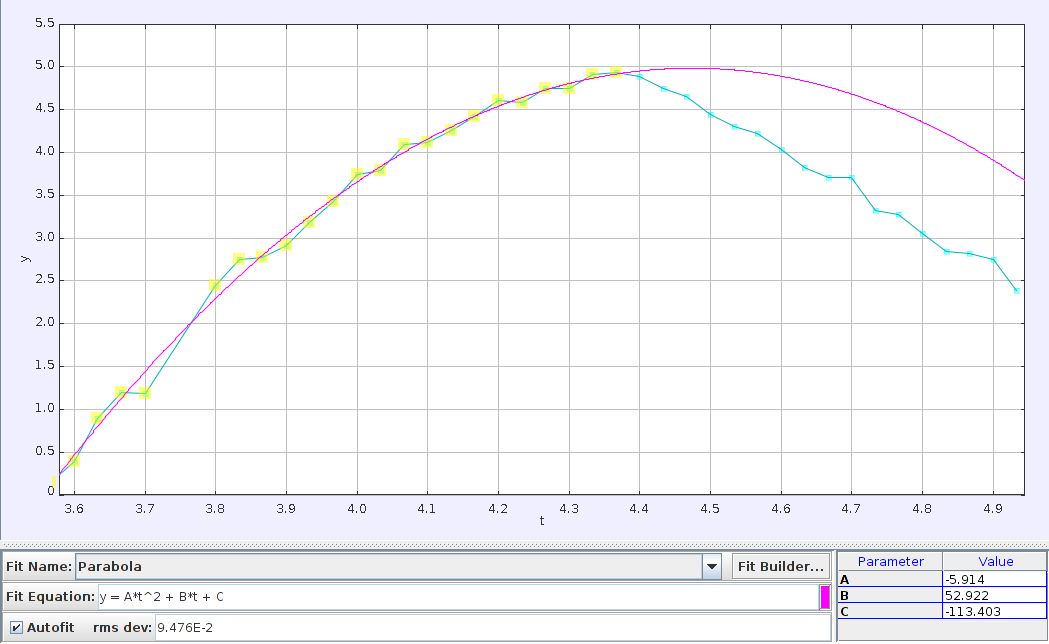
Same trick as before. I used Tracker to fit the second ball’s curve to a parabola (considering only data up till the collision). Then, I just multiply the parameter A times two to get the acceleration due to gravity. This time I get 
Before we take the next step, I need to introduce a new concept. Imagine that you have a firework in your hand, and you light it and throw it into the air. It begins to trace out a nice, neat parabola. What happens after it explodes? Suddenly, instead of one particle you have dozens, and everything looks like a mess. There is a way out of this mess, and it involves the concept of center of mass.
What physics tells us is that after the firecracker explodes, if we considered the average position of all the little exploded chunks of firecracker, then that average position (the center of mass) will still trace out a parabola. It doesn’t matter if it’s a tiny firecracker or a spectacular fireworks display, all the internal forces of the explosion will cancel out, and the center of mass will trace out a boring, old parabola.
What does this have to do with the two footballs? Well, you can think of a collision as an explosion in reverse. (Update: Added in that link, via Ed Yong on Twitter.) The same idea holds – the center of mass of the two footballs isn’t bothered by the collision. Now, of course, the forces in the collision will dramatically alter the trajectory of each football – they’re bumping into each other, after all. BUT, if you consider the two footballs as one extended system, then these bumps are internal forces, and they cancel each other out (Heck yeah, Newton’s 3rd Law). The upshot is that if we plot the center of mass of the two footballs, we should see a parabola that isn’t really affected by the collision.
Here’s a plot of both balls (red and blue), and the center of mass of the two balls (in green).
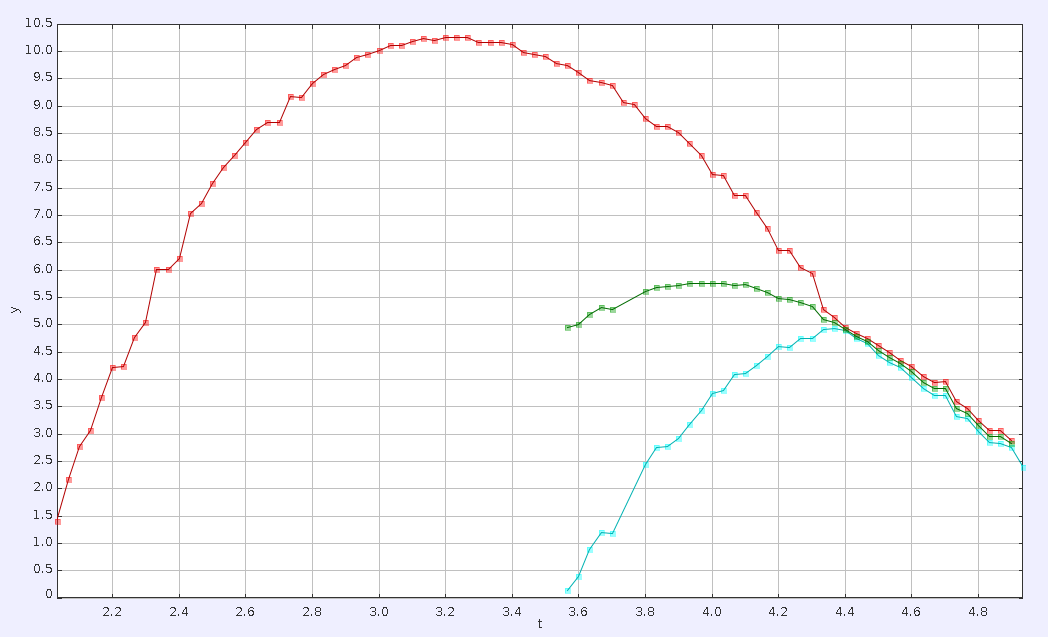
After the collision, the two footballs converge to their center of mass. (This is what physicists call a highly inelastic collision, because the two particles basically stick to each other. It means that the energy of motion, kinetic energy, isn’t being conserved, probably because the balls start to spin wildly and are therefore bleeding energy in to the rotational motion).
Now, I’m going to take the curve traced by the center of mass (in green) and fit the data points before the collision to a parabola. If this collision is really obeying the laws of physics, then the center of mass shouldn’t care about the collision, and the green curve after the collision should stay on the same path.
Here’s what I get:
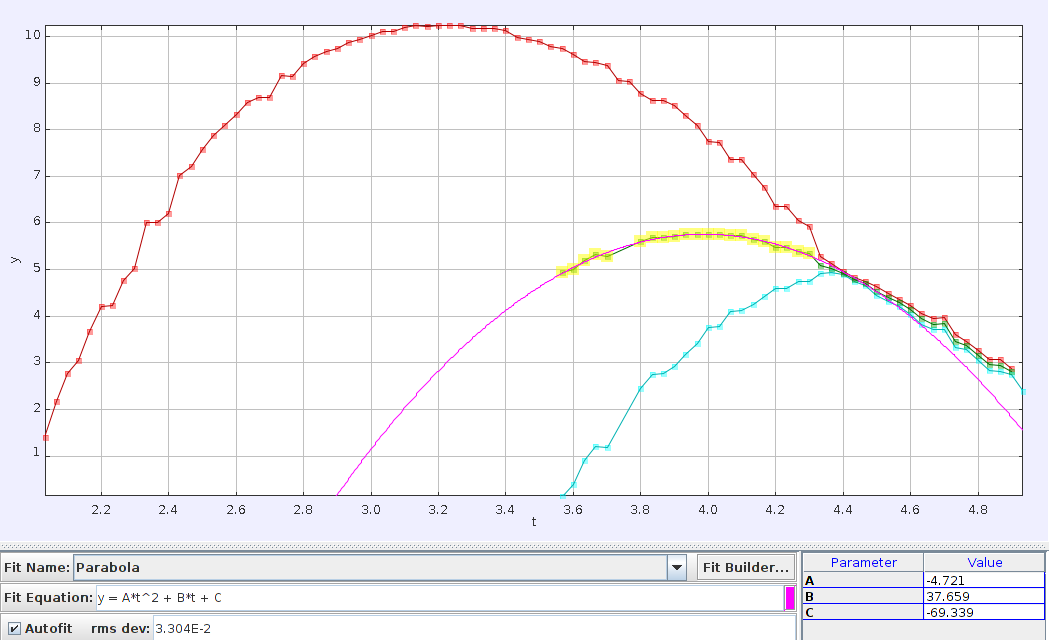
The pink curve is the predicted trajectory, based on extrapolating the center of mass motion from before the collision. The green curve (sandwiched between the red and blue) is the real data. It’s not dead on, but it’s no too far either.
One possible reason for the discrepancy is that after the collision, the footballs might move sideways to some extent (i.e. perpendicular to the plane of the camera). This would make the center of mass calculation inaccurate after the collision. Also, at this point the balls are at their furthest from the camera, so the perspective correction might not be so great at this distance.
I’m going to go ahead and say that this video is for real. No one would fake a video while also bothering to preserve the center of mass trajectory!
Kudos to you Håvard Rugland, and I hope you kick some ass in that NFL tryout!
Nerdy footnote:
When you have a hammer, it’s fun to hammer things. For no particular reason, here are a few more numbers that we can infer from the data. Rugland kicked Ball 1 at an angle of about 64 degrees at a speed of about 32 mph. About 1.5 seconds later, and 1.5 meters ahead, he kicked Ball 2 at an angle of 40 degrees and at a speed of about 38 mph. It’s a pretty cool testament to Rugland’s abilities that he’s basically able to solve a physics problem in his head that would give most undergrads a severe headache!
For more gratuitous (and hopefully fun) physics, check out my post on the physics of leaping lemurs, where I solve for the launch speed and launch angle of a sifaka lemur.